Unit 1.2 Why metadata matters
Overview
Unit study time
- 25 minutes
Intended Learning Outcome
By the end of the unit, you will be able to ...
- Explain the value of metadata creation for research impact, reproducibility, and user needs
- Explain how metadata supports understanding and comparison of data
You already use metadata intuitively when deciding whether data is useful and how to interpret it. This unit shows how that decision-making can be made explicit, structured, and reusable, for yourself, others, and machines.
Why create metadata? (recap)
You’re a researcher about to conduct a study — why might you want to create metadata?
Benefits of creating metadata for your research project:
- Increases the visibility of your study to other researchers and organisations
- Helps others find, understand, compare, and use your data
- Enables cross-study comparisons and secondary research
- Preserves your data and research context
- Makes data management processes more robust and efficient
- Enables more accurate, reliable, and higher-quality research
- Helps your future self understand and reuse the data
Metadata may also be required by:
- Your institution (e.g. contracts or project agreements)
- Funding agencies, to ensure data is reusable and FAIR
- Journals, as a condition for publication
- Supervisors, to encourage data citation and enhance research reputation
- Collaborative projects involving multiple organisations
For more information, see Introduction to Metadata.
Many of these reasons were introduced in the 'Introduction to Metadata' course.
This unit looks more closely at how metadata creation can:
- help your future self (and others) understand and reuse data
- support cross-study comparison and secondary research
- make data management more efficient
- enable more accurate and reliable research
In the 'Introduction to Metadata' course, we examined datasets using simple questions — who, what, where, when, how, and why to decide whether data was useful. In this training course and unit, we focus on the specific metadata elements that allow this information to be captured in a structured and linked way.
Before learning how to create metadata, it is important to understand why metadata matters in practice. This unit uses a simple example to illustrate the kinds of questions metadata helps answer, and explores how metadata supports decisions in practice.
Fictional example
We now introduce a fictional dataset and questionnaire, similar to one that might be used in a student project.
How to approach this unit
The aim is not to focus on the details of the exercise itself, but to think about:
- how decisions about data use are made, and
- how metadata helps make and demonstrate those decisions for yourself, others, and machines.
Later units will explore the metadata elements in more detail.
Questionnaire and data
Example questionnaire and corresponding dataset
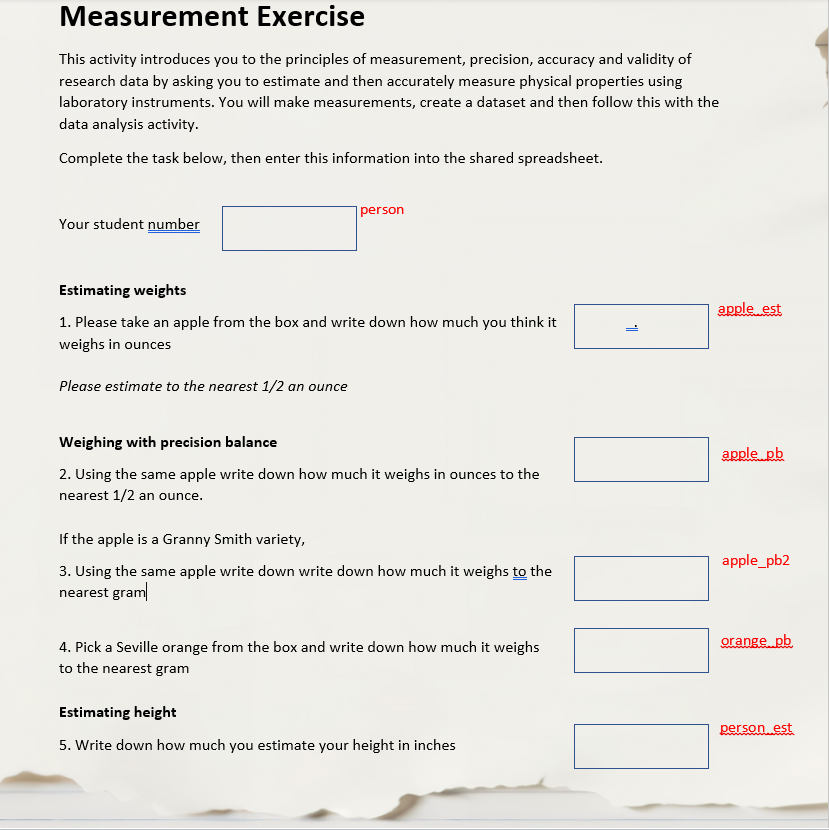
Example dataset
| person | apple_est | apple_pb | apple_pb2 | orange_pb | person_est |
|---|---|---|---|---|---|
| 1 | 6.5 | 170 | 165 | 140 | |
| 2 | 7 | 200 | 250 | 180 | |
| 3 | 18 | 250 | 270 | 370 | |
| 4 | 5 | 125 | 190 | 100 | |
| 5 | 6 | 115 | 140 | 275 | |
| 6 | 5 | 180 | 170 | 190 | 300 |
Exercise
Imagine this is an exercise given to students so they can practice using a balance, whilst introducing the ideas of systematic data recording, measurement unit selection, accuracy and precision.
Suppose you are the student analysing the data. You were not involved in the survey design and do not know the original intent of data collection.
Consider the following questions:
- What questions could you ask of the data?
- Which variables could (or could not) be compared?
- How did you make these decisions?
- What additional information would help?
Now imagine comparing this dataset with:
- the same exercise conducted over the last 10 years
- similar exercises at another university or school
This would raise new research questions and require additional metadata.
Possible answers
-
How well can students estimate weight? What are the differences in weight of apples and oranges? How many Granny Smith apples are there? What are the estimating capabilities of the students? Have Seville oranges changed in weight over time? On average, how much taller are students than pupils? ...
-
Consider: Comparisons between apples, between oranges, and between estimated and measured weights ...
-
How the variable was measured, the units of measurement, what the variable is measuring, what the measurement is applied to, whether any transformations are needed, and whether new variables need to be created...
-
How many students completed the task, whether the same type of balance was used for all measurements, when the activity took place, and who made the measurements...
Provenance
Some of the questions you are asking (e.g. how the data was measured, who collected it, and whether it has been transformed) relate to provenance. Provenance describes how data came to be, including who created it, how it was produced, and what processes or transformations it has undergone. Understanding provenance can help you assess whether data is trustworthy and suitable for your research. Provenance will be mentioned throughout the course and so is introduced here.
CODATA conceives provenance as...
"Type of historical information about the origin, location or the source of something, or the history of the ownership or location of an object or resource including digital objects." [1]
In order to answer these questions, we rely on the skills we have acquired through conducting research, analysing data, reading research papers, and through training, to intuitively interpret surveys and variables using wording, context, and formatting clues.
However, documenting the metadata and adding structure can help answer some of these questions.
Why structure matters
- to make decisions more systematically
- to identify new research opportunities
- to ensure quality and validity
- to support reuse by others and our future selves
- to compare across studies
- to enable machine processing and automation
Documenting the survey
Similar to the address example given in the 'Introduction to Metadata' course, we have split each element into a separate category. We tend to do this instinctively and in our heads, but documenting the metadata in this way can help our understanding even further, and is particularly valuable for more complex datasets or data collections.
Don’t worry about the details here
These tables illustrate how metadata can be structured. Some of the terms have been covered in the 'Introduction to Metadata' training course and will be recapped here, others may be new to you and will be covered in more detail in later units. You are not expected to memorise fields or terminology.
First we might start with documenting and understanding the survey.
| Label | Name | Question text | Instruction | Response domain | Numeric type | Response unit |
|---|---|---|---|---|---|---|
| qc_intro_i | Please take an apple from the box… | Estimate to nearest ½… | Numeric | Float | Student | |
| qc_1 | 1 | Using the same apple… | Numeric | Float | Student | |
| qc_2 | 2 | Using the same apple… | Numeric | Float | Student | |
| qc_3 | 3 | Pick a Seville orange… | Numeric | Integer | Student | |
| qc_4 | 4 | Write down how much… | Numeric | Integer | Student | |
| qc_5 | 5 | Write down how much… | Numeric | Integer | Student |
Variable-level metadata
| Name | Label | Unit of measurement | Representation | Numeric type |
|---|---|---|---|---|
| apple_est | Weight of apple (oz) | Ounces | Numeric | Float |
| apple_pb | Weight of apple (g) | Grams | Numeric | Float |
| apple_pb2 | Weight of Granny Smith (g) | Grams | Numeric | Integer |
| orange_pb | Weight of Seville orange (g) | Grams | Numeric | Integer |
| person_est | Height of person (inches) | Inches | Numeric | Integer |
Concepts and measurement context
So far we have pulled out information which is available directly from the documentation. As discussed above, there is additional information we intuit and use to make decisions about the data. We can also record this in the metadata. For example, what the variable is measuring and what it is being applied to. This can be seen in the table below in the concept and the unit type.
| Name | Label | Concept | Unit type | Method | Sub-universe |
|---|---|---|---|---|---|
| apple_est | Weight of apple (oz) | Weight | Apples | Estimated | All apples |
| apple_pb | Weight of apple (g) | Weight | Apples | Precision balance | All apples |
| apple_pb2 | Weight of Granny Smith (g) | Weight | Apples | Precision balance | Granny Smith apples |
| orange_pb | Weight of Seville orange (g) | Weight | Oranges | Precision balance | Seville oranges |
| person_est | Height of person (inches) | Height | Person | Estimated | All students |
How does metadata help?
Structured metadata helps turn intuitive judgement into explicit, reproducible decisions. When deciding which variables can be compared, we often rely on assumptions about what the data represents. By documenting this information clearly in metadata, those decisions become easier to make and easier to justify.
Deciding which variables can (and cannot) be compared
For example, if we want to compare apples and oranges, this might seem inappropriate at first because they are different types of fruit. However, by looking at the metadata table, we can see that both variables share the same concept (weight), method (precision balance), and unit of measurement (grams).
The key difference is the unit type being measured (apples vs oranges). Rather than preventing comparison, this difference defines the research question. Because everything else is consistent, it is valid to compare these variables to ask questions such as which type of fruit is heavier on average. In this case, the metadata makes it clear that the variables are comparable, and that the difference in unit type is exactly what the analysis is exploring.
Identifying when data processing is required
Metadata describing units of measurement and numeric type helps identify when additional processing is needed before analysis, such as unit conversion or additional processing. In addition, the numeric type clarifies the precision of each measurement, and where this differs from the variable-level metadata, it can indicate that data processing or transformation has taken place. Making this explicit supports correct, transparent, and reproducible data preparation.
Assessing whether datasets can be combined or compared across studies
Metadata such as response unit, method, population, and sub‑universe helps determine whether data collected in different contexts (e.g. different years, institutions, or participant groups) can be meaningfully compared or merged. For example, knowing that the response unit is consistent across variables (i.e. who completed the question) makes it easier to understand how this dataset could be combined with others, such as a pupil dataset, while still interpreting the data correctly.
What this exercise shows
When deciding how to analyse data, you rely on information about:
- what was measured
- how it was measured
- who or what was measured
- where and when data was collected
Metadata makes this information explicit and reusable.
Key metadata terms
Below are simple definitions used in this unit (expanded later):
- Question text – Exact wording shown to respondents
- Instruction – Guidance on how to answer
- Response domain – Allowed response values
- Numeric type – Subtype of numeric values
- Response unit – Who provides the response
- Unit of measurement – Measurement scale (e.g. grams)
- Representation – How data is stored
- Concept – What is being measured
- Unit type – What the measurement applies to
- Method – How the measurement was taken
- Universe – All elements eligible for study
- Sub-universe – Subset eligible for a specific question
- Population – Universe plus time, place, and context
By recording this information in structured metadata, the reasoning behind analytical decisions is no longer implicit or dependent on personal knowledge. Instead, it becomes explicit, repeatable, and understandable by others, including your future self. In this way, structured metadata supports not only analysis, but also transparency, reuse, and consistent decision‑making throughout the research process.
[!NOTE] HM/JJ Add dataset level metadata. Universe should be at the study level? No time and place bound so can compare across different populations. JJ Perhaps there needs to be something about the importance of metadata at the column level such as missing values is a mirror of the universe, so if there are not accurate missing values e,g, "n/a" vs "just missing" then you don't know the universe for which the measure if capturing. How do we say that simply? HM If we are keeping variable level metadata here, then an sub-universe for the condition? would this be too complicated here as part of the intro - or should we explore further in the universe section?