Unit 3. Metadata relationships
Overview
Unit study time
- 20 minutes
Intended Learning Outcome
By the end of the unit, you will be able to ...
- Explain why metadata elements must be created separately and linked
- Provide examples of what metadata could be linked to variable metadata
So far in this course and in the 'Introduction to Metadata' course, we have explored the different types of metadata and how we define each of the items or elements. The 'Introduction to Metadata' course demonstrated the importance of itemising each metadata element in order for us to be able to manage them using a computer address example. In this unit, we will demonstrate why this is important and how these pieces of metadata fit together.
When creating metadata, it can be tempting to put all the information together in one place, for example, attaching the concept, population, question wording, codes, categories, universe, and dataset details etc. directly to the variables. However, good metadata management keeps these items separate and defines relationships between them instead.
Think about all the metadata items we have discussed, and imagine adding all your metadata directly into a data file. If you embed all study‑level and dataset‑level information in the data file or at the variable level, you would need to repeat the same details such as Study Title, Principal Investigator, Universe, and Population for every row. This values would be repeated for every row in your data file, and possibly multiple data files (e.g. table 1 below). The result would be an unnecessarily large and difficult to maintain and use dataset, with columns that do not relate directly to the variables you want to analyse.
Table 1. Data file example (not recommended)
| income | age | employment | Study title | Principal Investigator | Universe | Population |
|---|---|---|---|---|---|---|
| 45000 | 35 | FT | Income Survey 2021 | Dr Smith | All individuals | Individuals in England in 2021 |
| 52000 | 44 | PT | Income Survey 2021 | Dr Smith | All individuals | Individuals in England in 2021 |
This structure shows study‑level and dataset‑level metadata repeated for every row, creating both inefficiency and a high risk of inconsistency. If the same information is stored in multiple places, there is a greater chance that errors or updates may not be applied consistently (e.g. a study title or population being entered differently in different rows).
A similar problem arises when handling codelists. You might decide to include all response categories from a question inside a single cell. As Table 2 shows, this quickly becomes unreadable and difficult to maintain, especially if it is used across multiple variables or datasets.
Table 2 dataset level example (not recommended)
| Variable Name | Concept | Universe | Population | Question Text | Codes & Categories | Study Title | Principal Investigator |
|---|---|---|---|---|---|---|---|
| income | Household income | All individuals | Individuals in England in 2021 | "What was your total household income last year?" | (none) | Income Survey 2021 | Dr Smith |
| age | Age of respondent | All individuals | Individuals in England in 2021 | "What is your age?" | (none) | Income Survey 2021 | Dr Smith |
| employment | Employment status | All individuals | Individuals in England in 2021 | "What is your employment status?" | 1 = FT; 2 = PT; 3 = Unemployed; 4 = Student | Income Survey 2021 | Dr Smith |
If you keep the codelist metadata with the question or other information, you would need to repeat that metadata for each row, making the table larger and harder to maintain. A more appropriate solution would be to separate them out into different cells.
Table 3. Question and category-level example (not recommended)
| Question label | Question text | Code | Category label |
|---|---|---|---|
| Q_EMP_STATUS | What is your employment status? | 1 | Full-time |
| Q_EMP_STATUS | What is your employment status? | 2 | Part-time |
| Q_EMP_STATUS | What is your employment status? | 3 | Unemployed |
| Q_EMP_STATUS | What is your employment status? | 4 | Student |
This is clearer, but we can already see the repetition and the challenges of attaching question‑level metadata directly to category‑level data.
These issues arise because the metadata elements relate to one another in different ways - some belong at higher conceptual levels (such as study or dataset), while others repeat across many variables or categories. This inherent mix of levels and multiplicity means that no single table can capture all metadata correctly without becoming redundant, inconsistent, or unmanageable.
Effective metadata management therefore relies on keeping elements separate and linking them properly.
Reasons to manage items separately
- Reduces redundancy and large unmanageable files. Repeating higher‑level metadata at lower levels leads to redundancy. This makes the data file: unnecessarily large, difficult to maintain, prone to inconsistencies, conceptually messy (metadata mixed with analytic variables).
- Improves readability and usability. Adding multiple items to a single cell element means it becomes unreadable, hard to manage, hard to edit, hard to reference.
- Avoids duplication (and the errors that come with it). Keeping items separate means consistency across the entire study.
- Supports reuse across waves, studies, and projects, reducing effort and increasing long-term value. e.g. a question can link to many variables, a concept can link to multiple questions.
- Supports machine readability and automation. Structured, separate items can be processed by tools, scripts, and metadata systems without guesswork or manual interpretation.
- Provides more clarity and meaning. If information is collapsed, users must rely on long descriptions, relationships become invisible, and errors and misinterpretations become more likely.
- Scalability. It is possible to scale effectively as studies grow, without becoming unmanageable.
However, it is not enough to document the item level metadata and know what each piece of information is. We also need to understand how different pieces connect in order for metadata to be used effectively. For example, we need to provide the link(s) between the variable and the study, or the question and the response categories.
Relationships help us organise, manage, discover, and reuse information effectively.
Managing metadata is managing relationships
When we talk about managing metadata, we are not managing the data itself. Instead, we are managing:
- the structure,
- the items, and
- the relationships between different items of information.
Good metadata management involves:
- Grouping similar items that represent real-world entities (e.g. all variables, all concepts, all datasets)
- Describing how they relate to one another (e.g. “this variable comes from this question in this dataset for this subset of the population”)
- Making these connections understandable to both humans and machines so tools can present information clearly, automate processes, create efficient research workflows
Managing relationships provides clarity about: what the metadata item is, how it fits within the wider structure, and how it should be used for both humans and computers.
Relationships between metadata add semantic context. Instead of isolated facts, you get a connected story.
Experiment ↔ version ↔ date ↔ location
This helps others (and your future self) understand why the data exists, not just what it is.
“This dataset was generated by this method, using this instrument, for this project.”
The following section will describe how key metadata components relate to one another and why managing relationships is central to managing metadata.
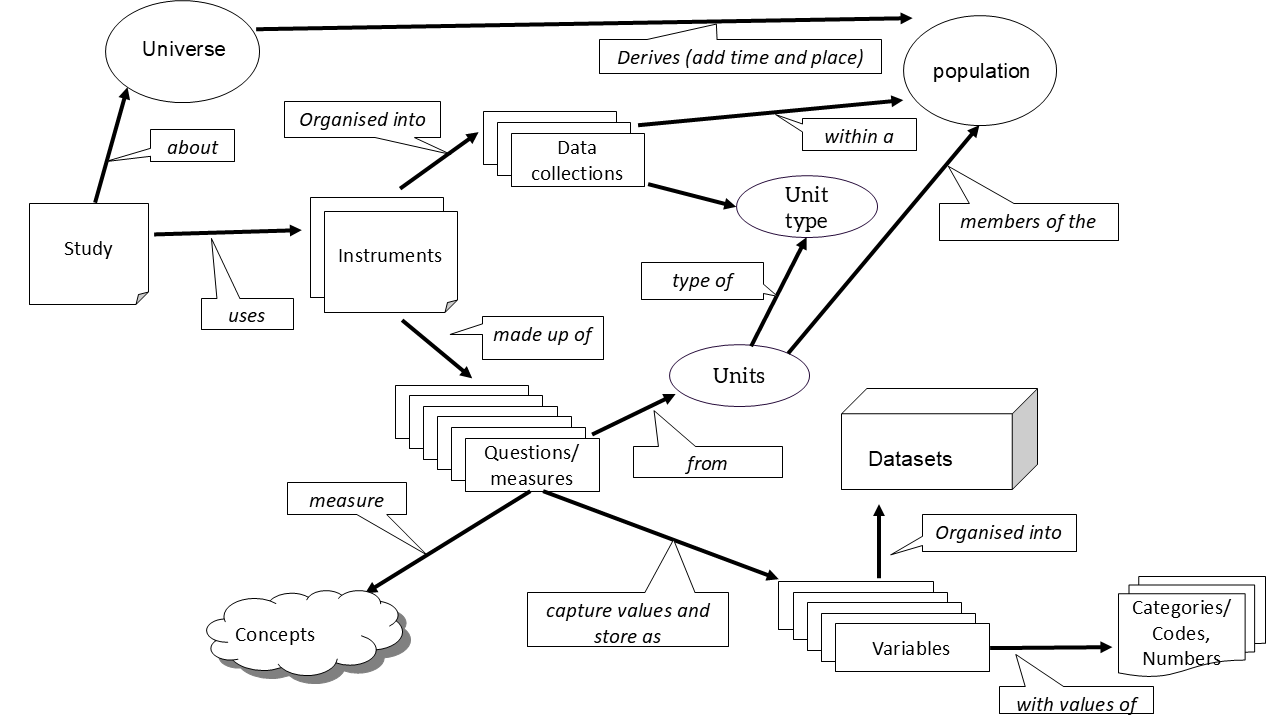
These relationships allow users to trace a variable back to its origin, understand its context, and interpret it accurately. They provide context and meaning. For example, if we have the variable "marital status" on its own, it doesn't include the additional metadata we require like the codelist or value representation, nor does it have the provenance. However, if we add links as shown in the diagram and below, we can find associated metadata.
| Variable name | Variable label | Variable description | Value representation | Data type | Missing value codes | Codelist reference | Dataset reference | Question / measurement reference |
|---|---|---|---|---|---|---|---|---|
| height_cm | Height (cm) | Height measured without shoes to nearest cm. | Numeric | Positive integer | -9 = missing | — | 7058_ylt11_teaching | Q_9 |
| birthdate | Date of birth | Date of birth in ISO 8601 format. | Date | ISO date | -9 = missing | — | 7058_ylt11_teaching | Q_4 |
| marital_status | Marital status | Self-reported marital status category. | Codelist | Numeric | -9 = missing | CL_marital_status | 7058_ylt11_teaching | Q_16 |
By managing relationships effectively, we help both humans and machines answer key questions:
- What is this thing? (e.g. a variable measuring income)
- What does it represent? (concept)
- Who does it apply to? (unit type and universe)
- Where did it come from? (question, instrument, dataset, study)
- How does it relate to other things? (derived variable, classification scheme)
Understanding these relationships ensures that variables and questions can be interpreted correctly. For example, knowing which respondents answered a particular question or were eligible for a particular measure can help you understand missing values in the associated variable.
Summary of benefits of managing metadata relationships
Relationships between metadata items...
- Explain how things fit together. Moves from isolated facts to a meaningful network. A variable on its own tells you what it measures. A variable with relationships can tell you; which question produced it, which concept it reflects, which universe was eligible to answer it etc.
-
Turn the metadata into a dynamic structure which can allow you to actively use the metadata to;
- trace provenance
- move between linked items
- automate documentation
- support harmonisation
- automatically generate questionnaires or data dictionaries
-
Helps you understand how to use something correctly. They supply the context that enables correct interpretation and analysis.
- Prevent duplication. They allow you to store each item once and link it wherever needed. This reduces workload, prevents divergence, and supports consistency across waves and studies.
- Support reuse and make metadata scalable and efficient.
- Make metadata machine-actionable.
Test your knowledge
Why are metadata relationships important for understanding data?
- They reduce dataset size
- They show how different pieces of information fit together
- They replace the need for metadata
- They ensure identical datasets
Reveal answer
They show how different pieces of information fit together. Understanding relationships helps users see how concepts, variables, and datasets connect, supporting correct interpretation.
Which sequence best reflects the relationship from abstract to concrete?
- Dataset → Concept → Variable → Code
- Concept → Question → Variable
- Dataset → Concept → Variable
- Variable → Concept → Dataset → Code
Reveal answer
Concept → Question → Variable. Concepts are abstract ideas, questions measure or capture them, variables store the resulting information, and datasets organise variables into a usable structure.
Why is it important to both manage metadata items separately and define relationships between them?
- Separating items makes metadata easier to store, and relationships ensure all items are kept in the same file
- Separating items avoids duplication and inconsistency, while relationships connect them so users can understand context and move between related information
- Managing everything in one place is more efficient, but relationships are needed to make the metadata larger and more detailed
- Relationships replace the need to structure metadata, as long as all information is described in text
Reveal answer
Separating items avoids duplication and inconsistency, while relationships connect them so users can understand context and move between related information. Managing items separately reduces duplication, improves clarity, and supports reuse. Relationships then link these items together, providing context and enabling tasks such as navigation, interpretation, harmonisation, and automation. Both are needed: without separation, metadata becomes duplicated and inconsistent; without relationships, it becomes disconnected and difficult to use.