5.2 Activity - Create Metadata Relationships
Unit overview
Unit study time
- 45 minutes
Intended Learning Outcomes
By the end of the unit, you will be able to ...
- Identify key dataset, variable, question, and code-level metadata elements
- Create structured metadata using a tabular template
- Apply good metadata practices to support understanding and reuse of data
In Units 2.5 and 2.8, we explored dataset and variable metadata elements and the benefits of creating structured metadata and in Unit 3 we explored the relationships between metadata. In this activity, you will apply this knowledge to a real example dataset.
We will use Excel to document metadata in this exercise. While other metadata tools exist which produce machine-readable output, we will use Excel as a flexible and practical starting point for creating and managing metadata. Excel is widely used, accessible, and familiar to many researchers. It allows you to structure metadata in a clear tabular format, apply basic validation rules, and organise information consistently without requiring specialist software. W
Excel
While Excel does not produce machine-readable format itself, the tables can be exported or transformed into machine readable formats, if the file follows a clear structure, data is clean and it doesn't rely on extra formatting such as colour, merged cells or notes. Excel also has features that can help ensure your metadata is clean, structured and standardised. For example, you can lock cells so that metadata element titles can't be changed or you can control what data can be input into certain metadata fields using data validation tools. This helps us to implement controlled vocabularies in our metadata creation (to recap controlled vocabularies, go to Unit 2.5 in the 'Introduction to Metadata' course) and reduces risk of human errors[1].
You can also download tools compatible with Excel. For example Collectica for Excel is an add-on for Excel which includes pre-defined metadata elements where you can input your metadata directly into the dataset file (rather than having a separate Excel file for your metadata).
We will practice what you've learnt using a small teaching dataset based on the 2011 Young Life and Times Survey delivered by ARK in Northern Ireland. The full dataset has been deposited on the UK Data Service and can be seen here.
Research practice example
Imagine you're a social science researcher who has collected data using the survey below.
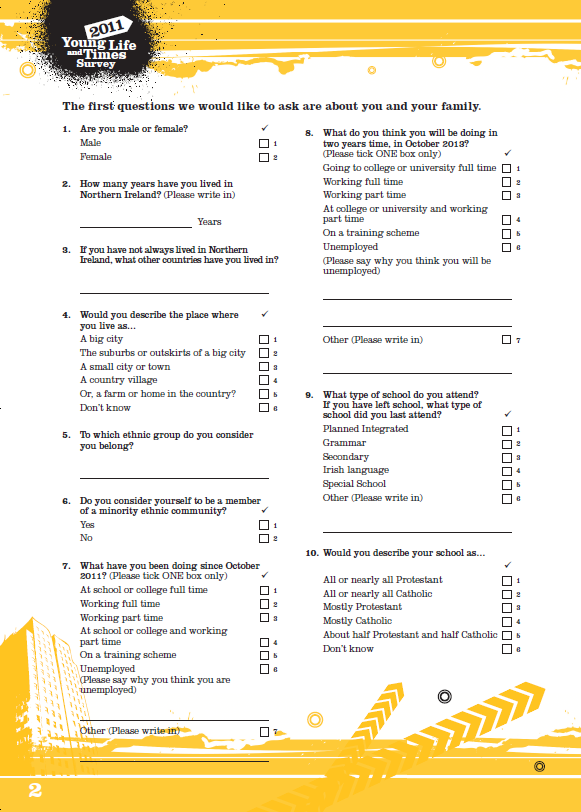
Through conducting this research you create the following dataset.
Dataset title: 7058_ylt11 teaching dataset
| respondentID | rsex | yearsni | placeliv | ethncat | memmec | thisoct | oct2yrs | typeschl | relschl |
|---|---|---|---|---|---|---|---|---|---|
| 1211 | 2 | 16 | 2 | [closed data] | [closed data] | 1 | 1 | 2 | 5 |
| 1212 | 1 | 16 | 3 | [closed data] | [closed data] | 1 | 1 | 2 | 1 |
| 1213 | 1 | 16 | 2 | [closed data] | [closed data] | 1 | 4 | 2 | 3 |
| 1214 | 1 | 16 | 5 | [closed data] | [closed data] | 1 | 1 | 3 | 2 |
| 1215 | 2 | 16 | 3 | [closed data] | [closed data] | 4 | 4 | 2 | 2 |
| 1216 | 1 | 16 | 1 | [closed data] | [closed data] | 1 | 1 | 3 | 2 |
| 1217 | 1 | 16 | 2 | [closed data] | [closed data] | 1 | 1 | 2 | 2 |
| 1218 | 2 | 16 | 3 | [closed data] | [closed data] | 1 | 4 | 2 | 1 |
| 1219 | 2 | 16 | 2 | [closed data] | [closed data] | 1 | 1 | 2 | 2 |
| 1220 | 1 | 16 | 2 | [closed data] | [closed data] | 1 | 1 | 2 | 2 |
ARK. Young Life and Times Survey, 2011 [computer file]. ARK www.ark.ac.uk/ylt [distributor], May 2012.[2]
If you want to use an alternative teaching dataset, you can find more on the UK Data Service. Expand the box below to explore more.
List of Open Access Teaching datasets from UKDS
- 2021 Census: Public Microdata Teaching Sample (England and Wales): 1% Sample: Open Access
- British Social Attitudes Survey, 2021, Health Care and Equalities: Open Access Teaching Dataset
- British Social Attitudes Survey, 2019, Poverty and Welfare: Open Access Teaching Dataset
- British Social Attitudes Survey, 2017, Environment and Politics: Open Access Teaching Dataset
- SN 7913 Opinions and Lifestyle Survey, Well-Being Module, April-May 2015: Unrestricted Access Teaching Dataset
- SN 7912 Quarterly Labour Force Survey, January - March, 2015: Unrestricted Access Teaching Dataset
You can download one of these datasets to practice metadata creation. In order to do this, you can download the dataset as a CSV or Excel file and download the user guide for the data so you have the background information about the dataset.
You want to preserve your data and document it clearly for your own records and share documentation where needed with colleagues and collaborators.
Task 1: Create the metadata
Think about the minimum metadata you would create for this study and dataset. You do not need to document every possible metadata element, but you should include enough detail to allow someone else to understand a couple of the variables. Document metadata at the following levels:
- Study metadata
- Question metadata
- Codes and categories metadata
- Dataset metadata
- Variable metadata
You can download and use this Excel template to organise your metadata. If you prefer you can use another tool as long as you create the metadata. Note the example answer will be in the template below.
Each tab contains a metadata template to describe different areas of the research project. Each metadata element relates to information you have already encountered in this course. If you add new metadata elements to the template, it is important to define them clearly and specify what information should be recorded. This helps ensure that your metadata is consistent and understandable to others.
Example answer
Download this completed Excel template to compare your answers.
Task 2: Map the relationships
Describe (or draw) how the following metadata elements are connected:
- Study
- Question
- Codes and categories
- Dataset
- Variable
Your aim is to show how a researcher could trace meaning across levels from a data value to its definition and context, in an efficiently organsised way. Think about how these relationships would appear in a table for example questions may include a column linking to Variable_ID.
Edit your Excel to include the relationships between the metadata across the worksheet tabs. If you prefer you can draw a simple diagram using arrows or describe the relationships using bullet points. Note the example answer will be in the template.
Example answer
Download this completed Excel template to compare your answers. Focus on how the different levels (study, dataset, variable, question, codes) are connected. Note the additional fields have blue text.
YLT Metadata template example relationships
What to notice in this example
- Studies can contain one or more datasets
- Datasets contain variables
- Variables are derived from questions asked in the survey
- Some questions use controlled response categories, which are defined in codelists
- Each level is clearly linked using IDs (Study_ID, Dataset_ID, Question_ID)
- Some questions (for example Q7, Q8 and Q9) include both a categorical response and a free-text response. Meaning, a single question can potentially generate more than one variable. In this example however, the dataset only contains variables for the categorical responses. It is not uncommon for information collected through survey questions to have no corresponding variable in a dataset.
- Variable metadata acts as the connection between questions and dataset metadata
- Codes are required to interpret categorical values
- The structure allows someone to trace meaning from value → variable → question → study, as it should reflect real life
This structure ensures that metadata is:
- connected
- consistent
- reusable
- easier to interpret
Task 3: Reflection
- Did using a structured template change the way you thought about metadata?
- What is one thing you will do differently when creating or using metadata after this activity?
Example answers
There is no single correct answer.
You may have thought about ...
- how structuring metadata across different levels (study, dataset, variables, questions, codes) makes relationships clearer
- how linking metadata using identifiers helps ensure consistency and avoids duplication
- how much context is needed for someone else to confidently understand and use the data
- how metadata is not just descriptive, but also supports interpretation and reuse
In the future you may try to...
- think more about what someone else would need to know to decide if the data is suitable
- aim to reduce ambiguity in your metadata by making things clearer rather than assuming knowledge
- check what information might be missing and how that affects usability
- be more intentional about what metadata to include, prioritising the information that matters most
- spend more time on metadata and recognise it as part of the research process, not an add-on
- refer to metadata standards, templates or schemas to ensure consistency
Summary
Well-organised metadata allows researchers to understand how data were collected, what variables represent, and how values should be interpreted. By focusing on structure, consistency, and relationships, you can create metadata that supports discovery, correct interpretation, and confident reuse of data.
References
- [1] Video explains the tools you can use in Excel to implement metadata best practice: https://www.uu.nl/en/research/research-data-management/guides/during-research/metadata-and-documentation
- [2] Access Research Knowledge (ARK) Northern Ireland. (2012). Young Life and Times Survey, 2011. [data collection]. UK Data Service. SN: 7058, DOI: http://doi.org/10.5255/UKDA-SN-7058-1